With housing now a top-five issue for the public, it seems everyone increasingly realises we need to be building more homes. But how do we work out exactly how many new homes we need?
Household projections are one way we can go about it, but this can seem like a chicken and egg game. Projections of new home requirements are based on the number of new households forming. But given our current housing shortage, the more new households there are likely to be, the harder it is for them to find affordable homes. This makes it less likely that people will set up homes of their own and…the fewer new households there are likely to be. With restricted supply, estimates of the number of new homes we need to build can go down with time, even though the population is growing.
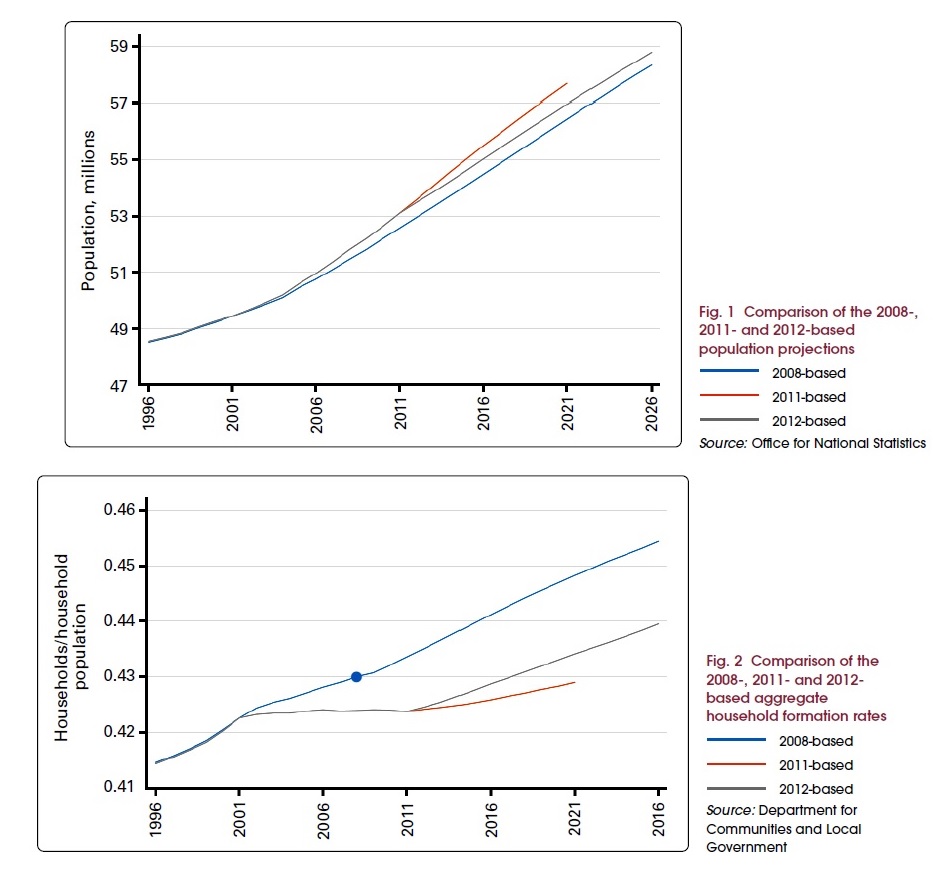
As a result, household projections are best viewed as a rough guide of what could happen given current trends. Comparing two projections produced at two different times can also indicate how trends have changed.
This is exactly what a new report from the Town and Country Planning Association has done. They use the DCLG’s most up to date projections based on the 2011 census to estimate what could happen assuming current demographic patterns continue. Contrasting this with 2008 projections, based on the 2001 census, also reveals what changed between 2001 and 2011.
The most recent projection suggests we will have needed to build an extra 222,000 homes each year between 2011 and 2031 to account for newly formed households. These figures give some indication of the pressing housing need we could face in the future but somewhat counter intuitively, the most recent projection is 22,000 homes per year lower than that made in 2008.
Why has the projection of household growth got smaller?
Rising prices are an indication that housing supply is failing to keep up with the demand for housing. So given the continuing rise in house prices and rents, it may seem weird that the trend in extra households needing new homes has been revised down. Also, this new projection uses a faster trend in overall population growth. So what is going on?
Remember, the number of new households is not just based on how many more people there are but how likely they are to strike out on their own and need a home. The new, lower projection reflects that fewer households were found in the 2011 census than was anticipated by the 2008 projection. Why? Between the 2001 census and 2011, when all household types are considered, the rate at which households formed flat-lined.
The ‘Clipped Wing’ generation
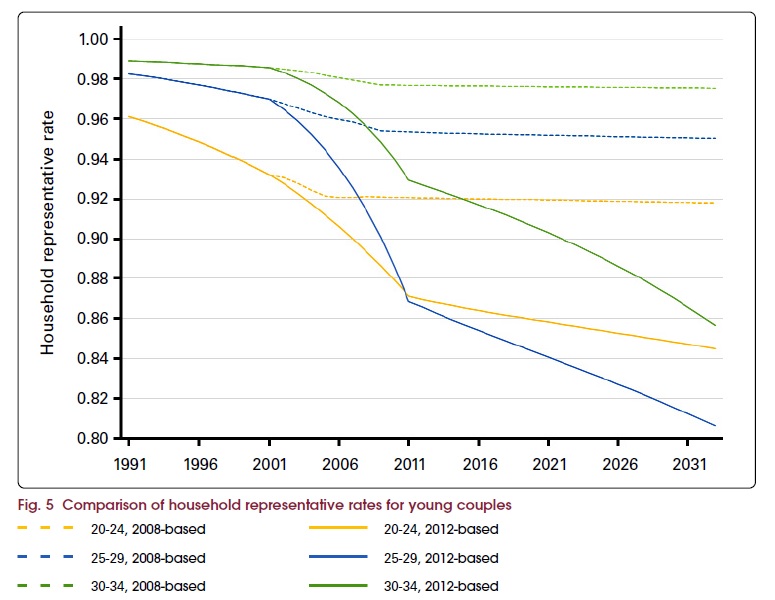
Worryingly, the biggest short-fall in household formation observed in the 2011 census was amongst the under 50s. This echoes Shelter’s previous findings that one in four working adults aged 20 to 34 now live with their parents. The same research suggests that a major reason for this has been housing affordability.
Particularly concerning is that young couples under 35 are increasingly struggling to move on to homes of their own. TCPA analysis emphasises that this isn’t a blip due to the recession; the trend started in 1991, pointing to young couples battling worsening housing affordability due to a persistent shortfall in housing supply.
A downward spiral
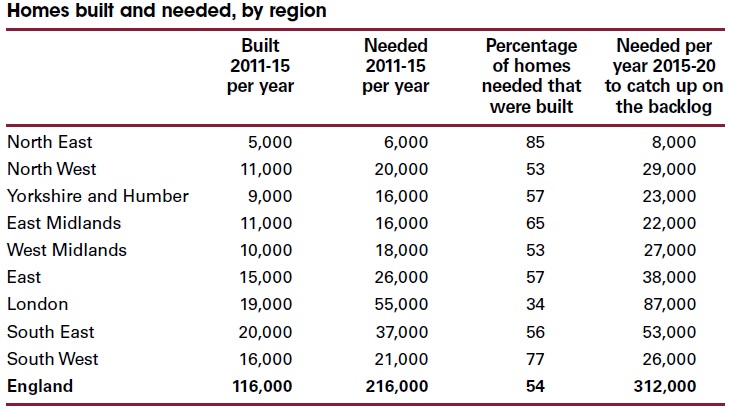
The squeeze on people’s ability to form households is likely to become worse than the DCLG figures imply, because we already have a backlog. Their projection suggests we should have been building 216,000 a year from 2011. But we’ve actually only averaged 116,000. So for the next five years we’d need to build 312,000 every year to catch up. Although the greatest need for homes (and the greatest backlog) is predictably in London, there is unmet need in every region; for example, only around half of the homes needed in the North West between 2011 and 2015 were built.
Unless this is rectified, it will become harder to find affordable housing to buy or rent throughout the country. Paradoxically, this means the next projection of homes needed may be lower again, as more people give up on finding a place of their own and share with friends or family instead.
Projections of new households can give a general steer as to how much to build and where but the government should also consider trends in how affordable housing is. Affordability gives a complementary picture of housing pressures, without forgetting to count those who have been discouraged from forming a household.
By any metric, the current backlog can seem overwhelming but there are many opportunities to mend our broken housing market. Unless we seize them, the shift between the 2001 and 2011 census suggests that we risk damaging younger generations’ opportunities for independence even further.