
The papers on housing affordability measures and their implications for policy released by UK Collaborative Centre for Housing Excellence (CaCHE) this week are an important contribution towards fixing the housing crisis. They highlight the inadequacies of how policy makers often conceive of affordability, and in turn how policy levers can be used to improve affordability.
The takeaway message from Professor Meen’s papers, as far as we’re concerned, is clear: the government needs to do a lot more work if they really want to solve the housing crisis.
In the 80’s, when ownership was within the reach of many, it was less problematic to think of affordability as no more than a ratio between incomes and house prices. But the market has moved on, and fewer households are able to get on the property ladder now because of high prices and restrictive lending practices (resulting from the 2007 recession). With fewer social homes available, renting privately is often the only option available for many, with housing benefit increasingly poor at relieving affordability pressures for those trapped in this sector.
As a result, we now need a more nuanced understanding of what affordability actually means.
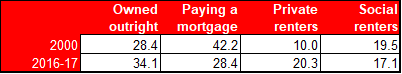
% English households by tenure 2000 and 2016-17 – English Housing Survey
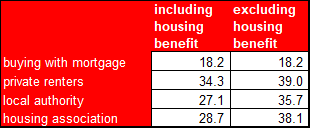
% household income spent on mortgage/rent – English Housing Survey (2016/17)
Show us the distribution
In 2004 the Barker Review shone a light on the challenges facing households; insufficient supply of new homes meant inflated housing costs. It also became clear that better data would be needed to get to grips with the dysfunctional market; the Valuations Office Authority (VOA) was asked to collect data on rents.
But I would argue we are still no closer to having the sort of data needed to understand rental markets. The CaCHE papers point out the importance of understanding the distribution of housing costs, rather than just the average, and this is data that is currently not widely accessible.
The VOA publishes estimates of rents on different size properties (including lower and upper quartile and median). It was only through freedom of information (FOI) requests that we’ve been able to obtain data on the full distribution of private rents across a small number of local rental markets. Analysis of this data underscores the need for nuanced understanding of affordability and the impacts of current policy making.
Two bed rent price distributions for four BRMA[1] areas in England (Nov 2016)
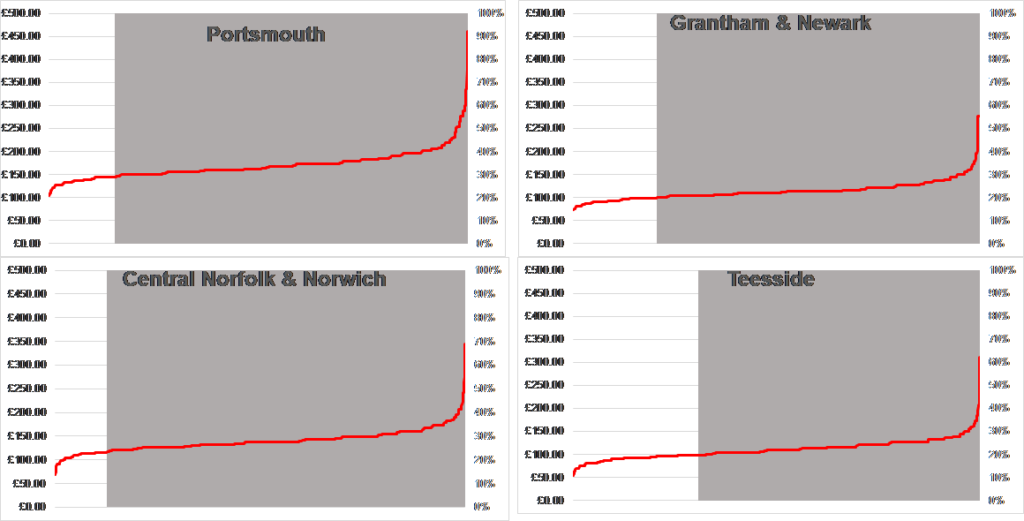
The charts above show four of the rent distributions or ‘rental areas’ that were supplied via our FOIs – the geographies used to set housing benefit payments. The red line shows rent prices from the cheapest on the left, to the most expensive on the right. The greyed-out areas show the properties which are not fully covered by local housing allowance (LHA) – thus unaffordable to those who need help with their housing costs.
The result? In Teesside around a third of rental properties are affordable to people claiming housing benefit but in Norfolk & Norwich only 13% of rental properties are. Cuts and freezes that have been imposed on LHA have had dramatically different impacts on different localities, leaving households in some areas with no options. But the data that reveals this is not readily available to researchers. Instead they have to rely on regional rent indices which use weighted data and no indication of distributions. Affordability analysis is only going to be useful if we have enough local level data that allows us to genuinely unpick it.
The veil of numbers
Even if we understand affordability, it is still not adequate for understanding housing choices. Housing choices are often about trade-off’s; expenditure for a home versus disposable income for living. A home may be affordable, but if it means hugely expensive commutes to get to work, is it still affordable? If finding a roof over your head means sacrificing access to good schools for your children, or proximity to friend and family – your support network – can affordability be a good enough measure on its own to describe trying to stay on budget? What do policy makers assume to be a reasonable compromise? Location, size, amount of mould in the bathroom?
Next steps
We would like to see government give more attention to the challenges all households face when trying to find a home. And we would want to see a greater emphasis on understanding the challenges for renters in particular; after all, 20% of households are paying rent to private landlords, only eight percentage points less than the number of people paying a mortgage.
It’s important that any development on measuring affordability works for all tenure types and housing aspirations. But equally, and as the reports highlight, it would be powerful for government to consider how new policies impact households across all tenures. For example, targeting Help to Buy at a minority of potential first-time buyers may worsen the options for a greater number of renters than it helps if it inflates house prices. Similarly, could policies focused on cooling local rental markets also have a positive impact on the cost of buying?
Better data used correctly can only help to support these policy decisions.
[1] Broad Rental Market Area – there are 156 BRMA in England, these are used to set local housing allowance i.e. the value of benefits paid for different sized properties (measured by bedrooms)