Get stuffed! Why we’re fed up with high house prices
Published: by Rachael Emmett
By Rachael Emmett

We made this film to highlight how out of control the UK housing market is. The dinner is so expensive because we applied the rate of inflation on house prices since 1971 to food. Yes, it’s unbelievable. But so is the fact that many families are finding themselves priced out of the housing market. And, as the impact of this trickles down to individual lives, some of these families end up homeless.
No one would expect to see these increases in food prices over time, so why is it okay for house prices?
A shortage of housing in Britain is driving house prices up. They’ve increased at the same time that house-building has decreased. Put simply, demand is outstripping supply and making it more difficult for families across the country to afford their housing costs[i].
Furthermore, with a lack of social housing, more people are forced into private renting. High rents make saving up difficult and any sudden drops in income put millions of families at risk of losing their homes.
We know 3.8 million families are just one pay packet away from losing their home – a terrifying prospect for all of us – while hundreds of thousands of people are cutting back on essentials, just to meet their household bills. And this Christmas in Britain 93,000 children will be homeless, with thousands of others on the brink.
All in all, our housing market is both unaffordable and unsustainable.
To end the housing crisis and give more people the chance of a stable home, we need politicians to build more affordable homes.
So how did we calculate the costs?
The prices in the film were calculated by applying the rate of increase in house prices since the 1970s to how much the food items were priced at the time:
The figures we used to work all this out are below:
Average price in 1971 in Britain: £5,646
Average price in 1974 in Britain: £11,021
Average price in 1975 in Britain: £11,812
Average price in September 2014 in Britain: £273,000[ii]
This gives an inflation of 48.34 times in 1971; 24.77 times in 1974; and 23.11 times in 1975.
This inflation multiplier was then applied to the 1971, 1974 or 1975 prices of a range of groceries, depending on the availability of prices for the goods. These prices were sourced from the Office for National Statistics, the British Library and the Sainsbury’s Archive.
Calculations are based on buying food for 8 people. Please see below for a full list of the items used and their weights or size.
Item | Weight/ Size | Year | Original price | Inflation | Inflated Price |
| Mince pies | 12 (items) | 1975 | £0.52 | 23.11 | £12.20 |
| Turkey | 11.2lbs | 1971 | £3.81 | 48.34 | £184.10 |
| Carrots | 3.5lbs | 1971 | £0.28 | 48.34 | £13.54 |
| Sprouts | 2.2lbs | 1974 | £0.52 | 24.77 | £13.08 |
| Lemonade | 2 x 2l bottles | 1971 | £0.42 | 48.34 | £23.15 |
| Christmas pudding | 2 puddings | 1971 | £0.54 | 48.34 | £26.11 |
| Gravy | 12 cubes | 1971 | £0.12 | 48.34 | £5.80 |
| Potatoes | 5.5lbs | 1971 | £0.50 | 48.34 | £23.97 |
| Stuffing | 1.5lbs | 1971 | £0.20 | 48.34 | £9.43 |
| Cranberry sauce | 2 x 250ml jars | 1974 | £0.32 | 24.77 | £8.04 |
| Pigs in blankets | 1lbs sausages 1lbs bacon | 1971 | £0.24 £0.61 | 48.34 | £46.84 |
| Total | £366.25 | ||||
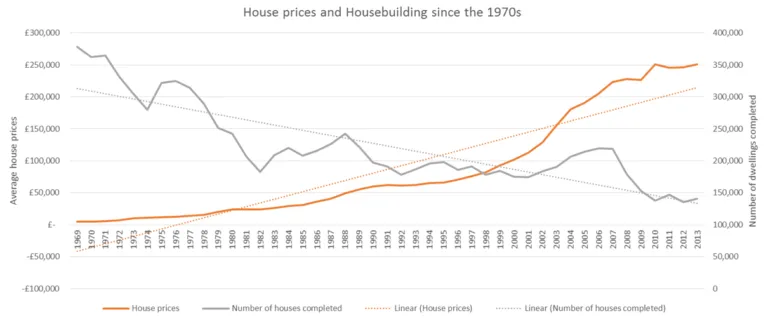
Source: ONS House Price Index (table 22) and DCLG Live tables on house building, August 2014, Live tables on house building, August 2014 (table 209)
[ii] Information on house price inflation was sourced from the ONS House Price Index tables (table 22, formerly DCLG live table 502 and table 2).