Wage against the machine – the tale of the first time buyer
Published: by Adam van Lohuizen
We all know that there is a housing crisis in England, that we aren’t building enough homes, that house prices are expensive, and that it’s difficult and costly for first time buyers to realise the dream of owning their own home.
But exactly how expensive are house prices now for first time buyers? It can be a difficult question to answer, but we’ve calculated that the average house price in England is £76,873 or 38.8% more than it should be. And that’s only for the increasingly small group that can still afford to buy a home. For those on average incomes that have been priced out the gap would be even bigger.
So how did we come to that number? The ONS publishes data on house prices, mortgage size, and incomes for first time buyers going back to 1969. Using this, we can see that house price and income growth broadly tracked each other between 1969 and 1997.
Average house prices, mortgages, and income for first time buyers in England 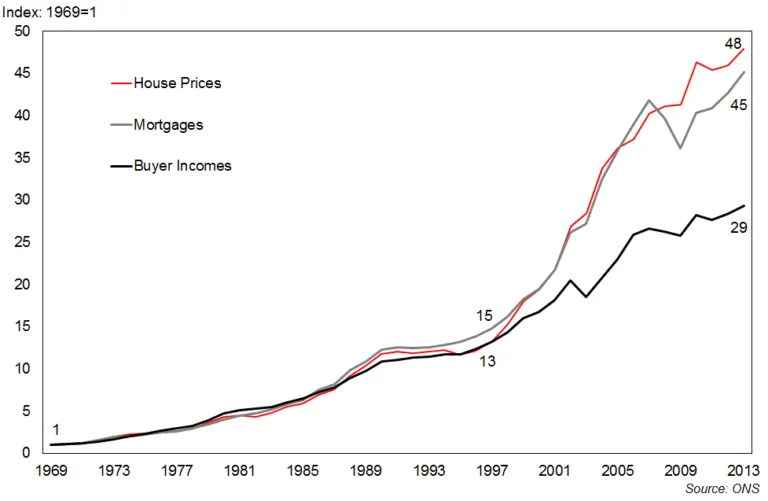
But since 1997, house prices have shot up well above incomes, to an increase of 48 times since 1969, compared with just 29 times for incomes since 1969. If house prices for first time buyers had only increased like their incomes, then the average first time buyer would have paid £121,166 for their home in 2013 instead of £198,039.
Across England, homes for first time buyers are between 30% and 40% more expensive than in 1969. First time buyers in London pay an even greater premium, with homes being 41.8% – or £139,203 – more expensive.
Average house prices linked to incomes – 1969 to 2013
Declining affordability has seen first time buyers’ incomes rise above average wages. Since 2004, first time buyer incomes have grown at almost three times the pace of the median income for 22-29 year olds, indicating that average income earners have been locked out of home ownership.
First time buyers and incomes in England/United Kingdom– 2004 to 2013 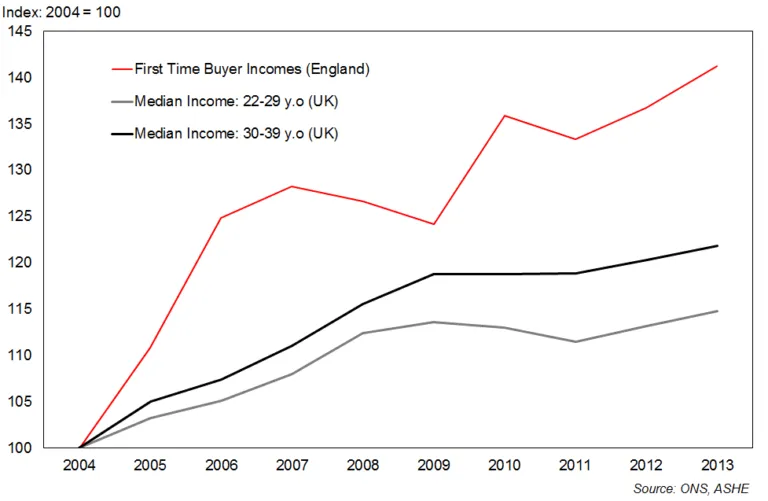
This is supported by the latest English Housing Survey, which shows how home ownership amongst younger age groups has fallen dramatically, implying that first time buyers have been getting older.
Rates of home-ownership by age – 1991 to 2013-14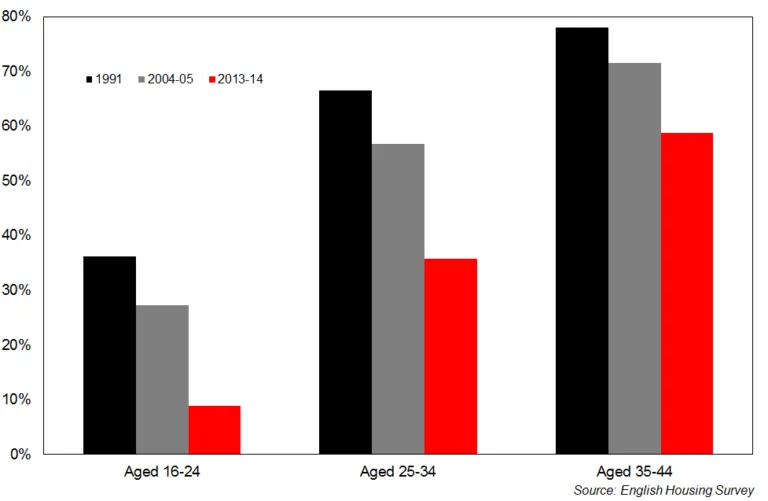
But age and incomes aren’t the whole story. First time buyers now borrow more – much more. For three decades, first time buyers borrowed around double their annual income to buy their first home. But this quickly changed, jumping from 2.4 in 2001 to 3.1 in 2004, and has remained around three times income ever since.
Loan to income ratio for first time buyers in England 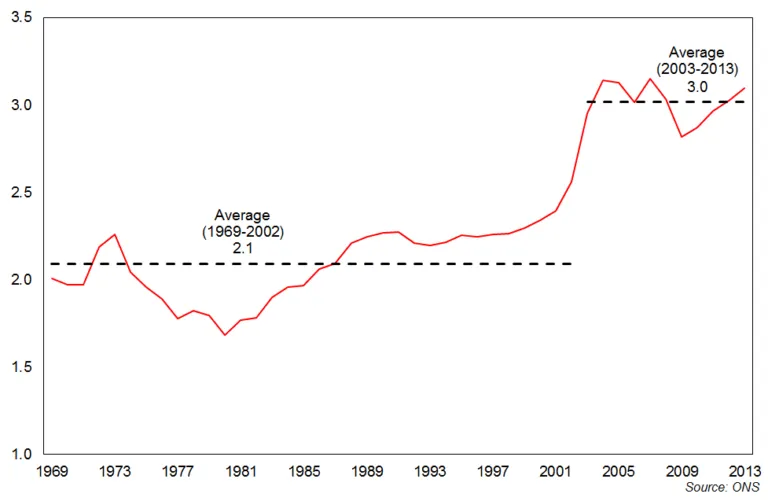
So how could they afford these much bigger mortgages? Apart from having to earn above average income in order to be a first time buyer, the long-term cost of debt has also fallen, allowing home buyers to borrow more.
Loan to income ratio for first time buyers in England and the Bank Rate (inverted)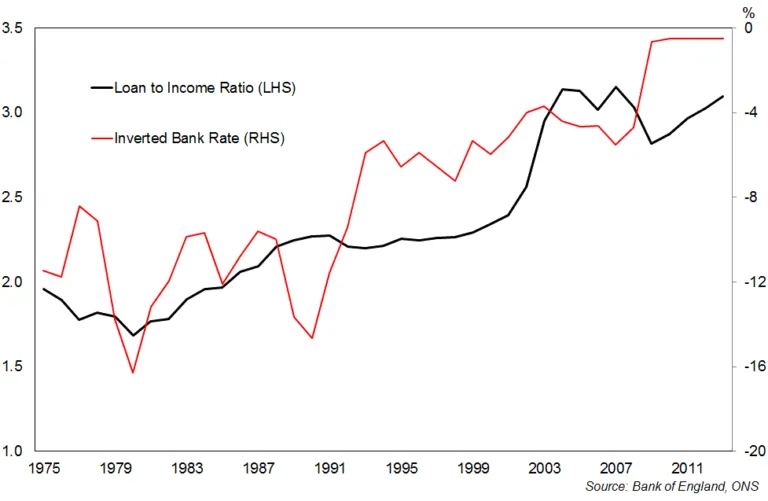
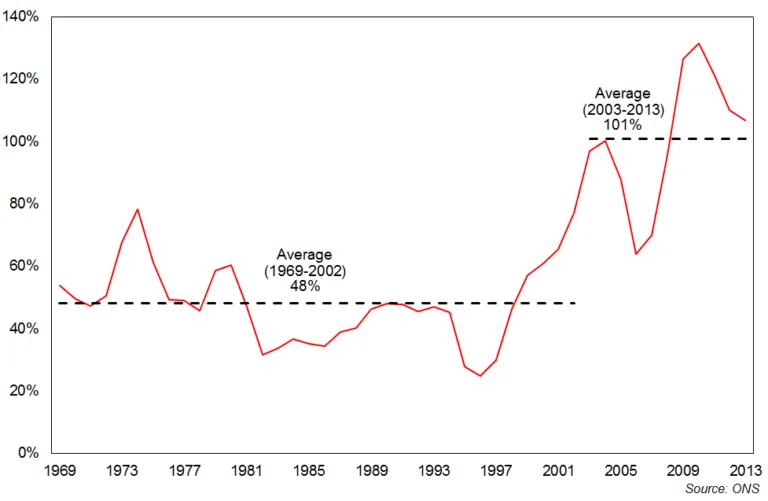
On top of all of this, first time buyers now have to save much bigger deposits. Between 1969 and 2002, first time buyers had an average deposit size of just under half their annual income, and only one quarter in 1996. But between 1996 and 2004, there was four-fold increase in the average deposit size.
Percentage of annual income required for deposit for first time buyers in England
So what does this all mean for future first time buyers? Interest rates are at all-time lows, and are now expected to increase. Future buyers won’t enjoy the long-term falls in interest rates that we’ve observed over the past three decades, whilst carrying much higher levels of debt. Unless houses become cheaper or incomes rise significantly, middle income earners will continue to be locked out of the housing market.
So how do we fix this? We need to build more homes. If nothing is done and house building stagnates, home ownership will remain nothing more than a dream for most, and a reality for only a lucky few.