The English Housing Survey
Published: by Alex McCallum
Today saw the release of the English Housing Survey (EHS) – the most important source we have for understanding the housing crisis. This government survey collects details on the quality and conditions of the homes households live in. This includes the cost and affordability of those homes.
As the survey has been running for 50 years (in various forms), it’s an invaluable record of how the situation of English households has changed over time.
Home ownership down
An Englishman’s home is his castle, they say – however in 2016-17, this phrase feels like a fairy tale. In less than a decade the number of families having to rent a home in the private rental sector has increased by a million. That’s 1.8 million families with children now in the private rental sector.
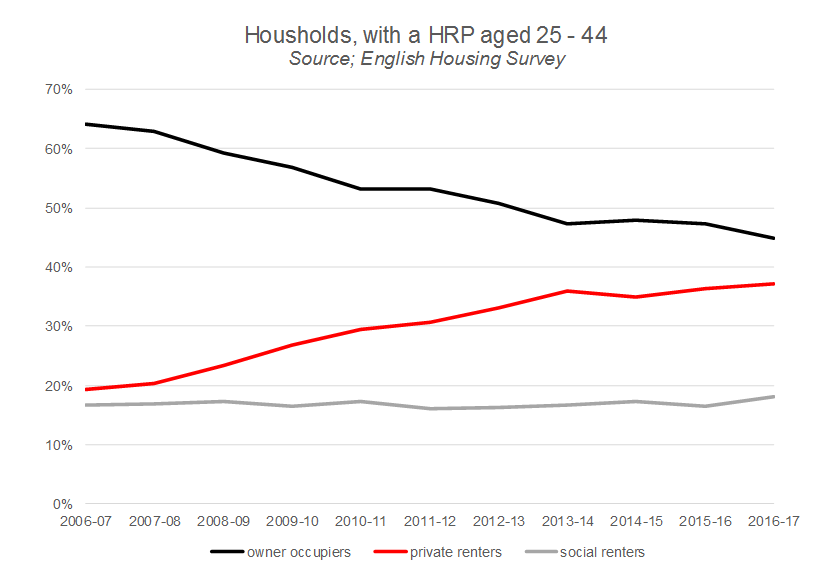
Now three in five (63%) households are owner-occupiers, down from a peak of 71% in 2003. The cause of this decline? Younger households are finding it harder to get on the property ladder. As this chart shows, the proportion of younger households in owner occupation has been dropping for some time.
 The average first-time buyer is now 33 (34 in London) and the average deposit is £49,600. There’s not much higher it can go either – particularly given that half (52%) of buyers now opt for a mortgage of over 30 years. Because there are fewer young people buying, homeowners with a mortgage are now in the minority. Most owners have paid off their debt.
These changes add up to a very different situation for policy-makers. For example, looking at just those households paying housing costs (rent or mortgage), renters now outnumber homeowners with a mortgage by three to two (mortgage holders equal 43%, private renters equal 31%, and social renters equal 26%).
Renters worse off
The EHS asks respondents to rate their life satisfaction – and it probably won’t surprise you that renters report the lowest levels of satisfaction. This may be because on average, renters pay more for a worse quality of home.
Typically, mortgaged home owners will spend 19% of their income on housing costs, while private renters pay double this proportion (41%). Social renters also pay much more of their income on rent – 31% of it in fact.
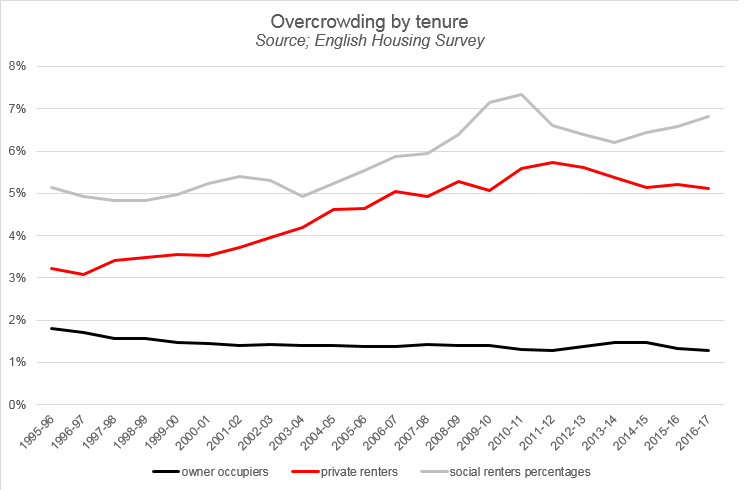
Both social and private renters are more likely to be in an overcrowded home (shown below).
 And where one in five (20%) owner-occupied homes are in poor condition – or ‘non-decent’, as the EHS property surveyors define it – the number is one in four (27%) in the private rental sector.
Finally, renters get less space too. For example, only 3% of owners live in a home with fewer than 50 square meters of floor space; for renters, it’s 16%. At the other end of the scale – 110 square meters or more – a third (34%) of owners will have this amount of space, compared with only a tenth (11%) of private renters.
What next?
The government will no doubt consider the extent to which it needs to offer policy solutions for households not looking for, or paying a mortgage. Perhaps we’ll see greater support for policies aimed at renters – like the improvements seen in the Fitness for Human Habitation Bill.
Many renters now expect a future where home ownership will not be an option. That means more truly affordable homes, fit for families, need to be built. We continue to shape this agenda, and recently launched our Big Conversation to examine the part social housing plays in the housing crisis.
- Get your voice heard at a national level – registering your interest to take part in our Big Conversation now.