Home ownership – is this the comeback?
Published: by Liam Reynolds
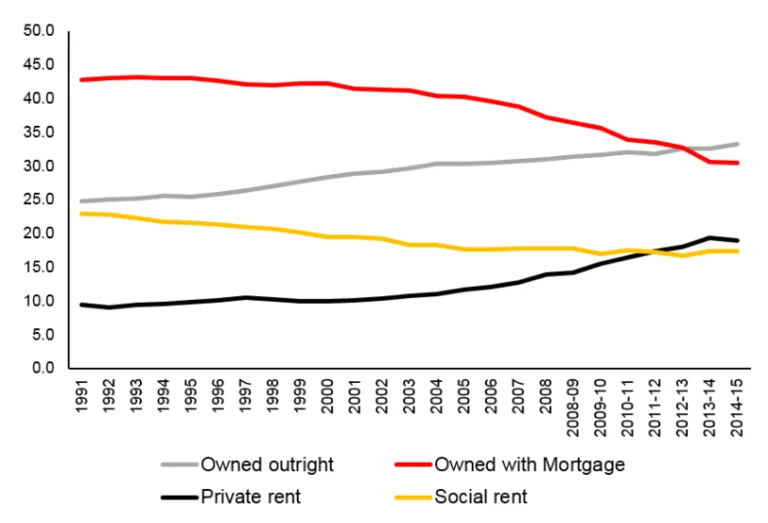
Yesterday was a big day in the world of housing research – the government published the English Housing Survey (EHS) headline report for 2014/15. This contains a wealth of fascinating insight on housing in England, but the main story always tends to be the tenure figures. Over the last 15 years this survey has tracked one of the biggest changes in society – the drop in home ownership, specifically mortgage holding, and the rise of private renting. The enormity of this trend cannot be underestimated. Since the turn of the millennium the proportion of mortgaged homes has dropped from 42% to 30% and the PRS has risen from 10% to 19%.
But yesterday’s figures appeared to mark the turning of the tide. Home ownership is up, private renting is down, so the government’s medicine must be working, right? That is what some are saying, but a deeper look at yesterday’s figures reveals a far less certain picture.
But home ownership has at least stopped falling hasn’t it?
This is true, but it seems to be driven by the continued rise of outright ownership rather than any increase in mortgaged home owners. In fact, although not quite statistically significant, the EHS reports nearly 100,000 less mortgaged homes than last year. The proportion with a mortgage (30.4%) is the lowest on record, lower than in 1981. This suggests few first time buyers (who normally need a mortgage), while a lot of older homeowners have taken advantage of low interest rates to pay off their mortgages. It may also be due to the rise of cash buyers. So the change in overall home ownership is more about well off people reaching the top of the ladder, rather than struggling families getting onto it.
OK, but there are fewer private renters, that is a good sign, right?
Well, first of all, there is an element of doubt over this. DCLG have told us that there is likely to be a methodological reason for an over counting of private rented homes last year, so it may be that it hasn’t actually fallen at all.
Secondly if we look at the proportion of homes that are private rented (19%), this hasn’t actually dropped by a statistically significant margin (it was 19.4% in 2013/14).
Finally, even if there are less renters than last year (which is up for debate), where have they gone? They do not seem to have got a mortgage or a social rented home. Rather, it seems they just haven’t ‘formed new households’ in as big numbers as in recent years. With the well documented rise in adults living at home with their parents, it seems likely that if there are slightly less renters than last year, one of the main factors will be because it is too expensive for them to move out of the parental home and start renting. Backing this up, it is London renters, and those aged 25-34 who seem to have fallen away the most – not families with children, which is where you would expect the reduction to be if this was the start of a homeownership revival. The number of renting families has continued to rise and now stands at 1.6 million. Back in 1991, the Census recorded little over a quarter of a million privately renting families.
So why are some claiming this shows the medicine is working?
It is natural to jump on the EHS results, it is an exciting day, we all do it! But, take a step back and remember two important things about these EHS results.
Firstly, this is a sample survey, and has a margin of error like all sample surveys. Yes, the sample is big – around 13,000, but this still means each result on the whole sample is subject to around a +/-0.75 per cent margin of error, and for subsets like London or families this is 2 per cent or more. So, given these margins of error, we have the rather less exciting news that in fact hardly anything has really changed since last year’s results. It’s risky to hang on one particular annual change in the EHS figures and the more sober observers will look at longer time periods.
Second, the fieldwork for this survey closed in March 2015. Any scheme, policy or announcement made by the new Government cannot have impacted on these results.
Before anyone saves this blog ready to wheel out next year, I not saying that the decline in homeownership has not been arrested, just that it is too soon to say. The chart below shows very clearly that we are talking about turning back a huge tide of social change. The size of this challenge should not be underestimated just because of one set of EHS figures:
Tenure trend since 1991 – proportion (%) of households (English Housing Survey, DCLG)