Toblerones and tenancies – ‘shrinkflation’ in the private rental sector
Published: by Alex McCallum
While it’s not been added to the Oxford English Dictionary yet, ‘shrinkflation’ isn’t a new concept for economics or housing. If you’re a fan of the triangular chocolate treat, you’ll be aware of the hoo-ha earlier this year when the makers of Toblerone effectively increased the cost of the product by putting less in the packet.
I don’t think I’m going too far by saying that many people felt the whole affair was a bit of a con. It’s inflation – but not as we know it.
Why am I interested in this now? Because the Annual Survey of Hours and Earnings (ASHE) came out last week – and the results got me thinking about housing affordability. Incomes have grown by about 2.2%, there were relative income rises for low earners and women workers. However, even though pay was up in real terms (accounting for the higher cost of living) wages have actually shrunk by about 0.4%.
How does this compare with the cost of housing? Well, for people looking to buy a home of their own it’s bad news. During the same time period, house prices went up by 5.6%.
Strangely, renters should be feeling okay because rents only grew by 2.1%.[1] I say strangely, because this doesn’t fit with what our supporters tell us. So, what’s going on?
Shrinkflation in private renting
If landlords want to increase their profits, they have the option of carving up their properties so that there are more units, or bedrooms, to let out; fitting more tenants in the same space. Shrinkflation is hiding worsening affordability in the private rental sector.
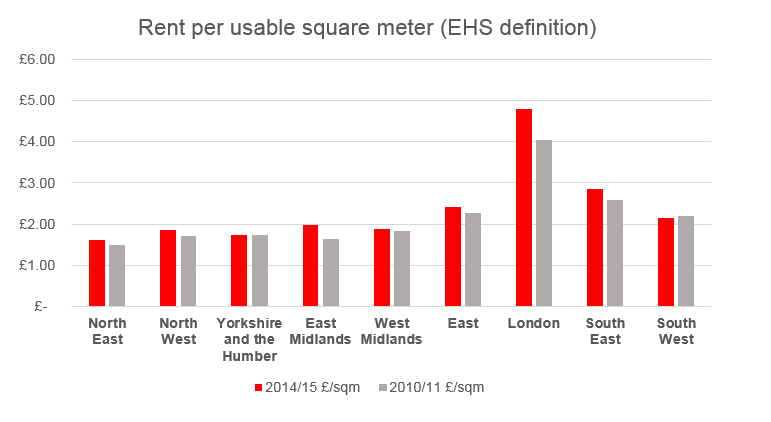
How can we see this? A useful source for this question is the English Housing Survey (EHS). It collects data on the physical details of homes and the circumstances of the households that live in them. I have looked at floor space[2] to see whether shrinkflation is an issue for renters.

Source: EHS 2010/11 and 2014/15 – Shelter analysis
The chart above shows that the cost per square meter increased over a four-year period, but this is not surprising – we know costs are going up.
Things become interesting when you compare this square metre measure of rent inflation with what is published in the Index of Private House Rental Prices (IPHRP). It measures the change in the cost of rental units, not floor-space cost.
Average (four-year) price increase in the private rental sector – £ per square metre vs £ per unit
| North East | North West | Yorkshire & Humber | East Midlands | West Midlands | East | London | South East | South West | |
| EHS £/psm – (4yr ave) | 1.86% | 2.3% | 0.0% | 4.9% | 0.7% | 1.6% | 4.5% | 2.5% | -0.6% |
| IPHPR (4 yr ave) | 0.72% | 0.83% | 0.94% | 1.13% | 1.15% | 1.36% | 3.72% | 2.11% | 1.55% |
Source: EHS 2010/11 and 2014/15, IPHPR – Shelter analysis
These numbers should be the same (or at least similar – they are statistics drawn from different sources after all). But as you can see, they are quite different. Several of the large positive differences are in expensive areas too, but the difference in London is less pronounced than the East Midlands or North East.
So what is this telling us? The numbers above make a lot of sense in fact. Renters in London will all have experienced going into flats that have clearly been partitioned to create more self-contained units. It’s been going on for years. Elsewhere in the country – where new rental markets are getting hot – the process of chopping up units to collect more rent looks to be getting under way.
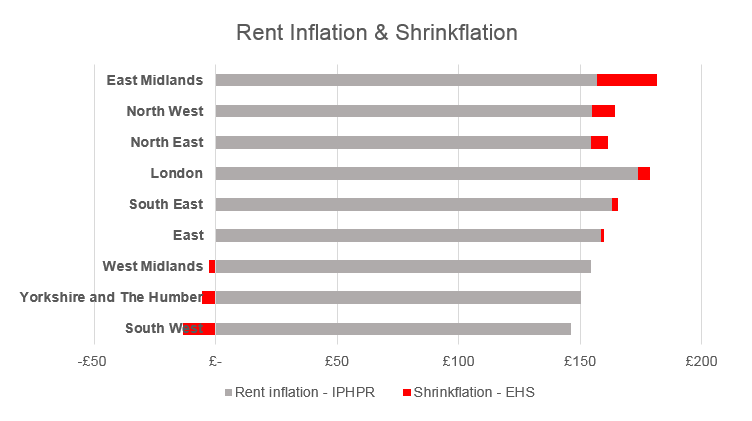
In popular towns and cities, where demand is high already, space comes at a premium. So if you need more space because you have a family, it really is going to cost more that rent data suggests. How much more?

Source: EHS 2010/11 and 2014/15; IPHRP – Shelter Analysis
If you apply the numbers to a property costing £150 a week to get the same sized property 2014/15 as you had back in 2010/11, it would cost you over £9 a week more in the North West and a staggering £25 a week more in the East Midlands. And remember, this on top of the visible increases in rent.
How can we combat this issue? Firstly, we’re calling on the government to build more genuinely affordable homes. Secondly, we want to see an end the freeze on Local Housing Allowance (LHA).
If you increase supply, and give renters more choice, then they won’t have to make uncomfortable compromises just to get a roof over their heads.
[1] Experimental Index of Private House Rent Prices – year up to April 2017, GB excluding London (which saw a 1.7% rise)
[2] The EHS uses a measure of usable square meters per property to calculate the cost per square metre. The usable floor space was combined with the reported rent value.