One step forward, two steps back: A decade of social housing decline
Published: by Reshima Sharma
In an interview with ITV news yesterday, Robert Jenrick, the Secretary of State for Housing, Communities and Local Government, claimed that the government had built 150,000 social homes in the last decade. But this is only half the story.
In the last decade, we have lost more than 282,000 social homes, and are not building enough to make up for the loss. With so many social homes disappearing to sales and demolitions every year, the government is taking one step forward and two steps back when it comes to delivering the social homes we desperately need.
A net loss of 135,000 homes
While the government has not quite built 150,000 homes for social rent in the last decade, as Jenrick said last night, he was fairly close. 147,409 social homes have been built since 2010/11 – but, as we’ll see, the reality is far more complicated than that.
Today, social housing is mainly delivered through one of two ways: central investment from the government via funding allocated in the Affordable Homes Programme (AHP), and negotiations between local authorities and developers via Section 106 agreements.
In the past, the majority of social homes were centrally funded through the Affordable Homes Programme. This usually runs for about five years and sets out the government’s capital investment in affordable and social homes.
In the 2010 Spending Review, the new government set out its first AHP, which ran between 2011 and 2015. The level of capital funding from the government to build new affordable homes was cut by 60% compared to the previous programme which ran from 2008 – 2011.
The below graph shows how social housing delivery peaked at the beginning of the decade. This is because most of the social homes built at the beginning of the decade were already funded by the previous AHP, as homes take time to build. The impact of the new AHP and the cuts to grant funding for social and affordable homes can be seen from 2012-13 onwards, when the delivery of social homes sharply drops and continues to dwindle.
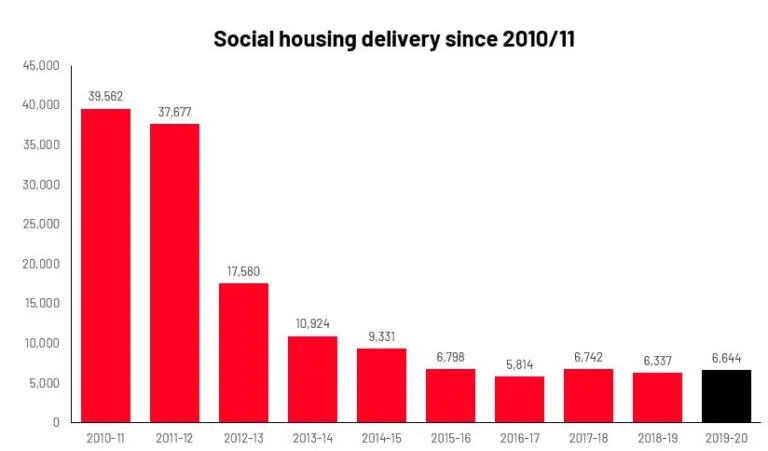
Reference: MHCLG, Live tables on affordable housing supply, Table 1006C (i)
In the last ten years, the majority of social homes have not been centrally funded by the government at all, but instead through Section 106 agreements. These are negotiations between developers and local authorities, which require developers to provide a certain number of affordable and social homes on new developments.
With central investment all but dried up, Section 106 now accounts for the vast majority (57%) of all new social homes built. So, if we remove Section 106 from the equation, the picture for social housing is even less pretty.
This graph shows how many social homes have been fully grant funded by the government since 2010/11.
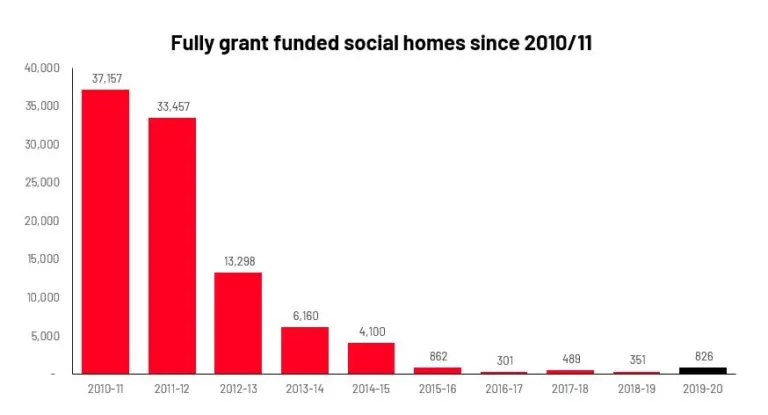
Reference: MHCLG, Live tables on affordable housing, Table 1011C
But this still isn’t the full story
Social housebuilding is at its lowest rate in decades. But at the same time, we’re losing social homes at a much greater rate through sales, demolitions, and conversions to other types of housing.
In the last decade (2010/11 – 2019/20), over 200,000 social homes have been lost through sales – predominantly through the Right to Buy scheme which enables many social tenants to buy the home they live in at a large discount. On top of that, more than 64,000 social homes were demolished in the same period.
This results in a net loss of more than 135,000 social homes in the last decade**(ii)**: a horrifying figure when we know that the housing emergency is just getting worse. Our recent research reveals just how widespread the housing emergency has become. More than one million households are on social housing waiting lists across England. More than 200,000 people are trapped in temporary accommodation, half of whom are children. And many more families up and down the country are trapped in expensive, poor quality homes because they have nowhere else to go.
The minister was also shown images of social housing residents, who spoke powerfully about the appalling conditions they’re trapped in. Damp wallpaper peeled from the walls; ceilings had fallen through. Look out for our blog on Monday 26 July, where we’ll be looking at his response to that and the need for change.
Want to build a different future? Join our campaign and call on the government to build social homes today.
(i) This table excludes homes that haven’t been fully grant-funded through Homes England or the Greater London Authority. The table does not include section 106 homes that were in part funded through grants. It also excludes homes delivered through other funding (e.g. private finance).
(ii) The net loss of social homes in the last decade is calculated by comparing the 2010/11 – 2019/20 number of social rent homes completed with the number of social homes lost through sales and demolitions. We have assumed that all the sales and demolitions were previously let at social rent. Even more social rent homes are likely to have been lost through the conversion of social rent to other less affordable forms of renting.